Effective Innovation Using DOE
Abstract
How can you get the most information at the lowest cost for the least amount of work? Objective Experiments. This efficient, economical method for creating desirable products of high quality is your best strategy. Three examples from industry will be presented: improving the quality of printed transparencies at Hewlett Packard, developing a high quality pigmented black ink-jet ink at Lexmark International, and developing a superior pressure sensitive adhesive at Monsanto. Two of these examples come from the direct experience of the author.
Introduction
Before the middle of the twentieth century engineers relied on holding all factors in an experiment constant except one, which they varied to find its optimum level. They then repeated this one-factor-at-a-time approach for each factor. This technique is subjective and has two big weaknesses, but it was the best experimental strategy available.
During the early portion of the century the science of Design of Experiments (DOE) was developed. DOE corrected the weaknesses of the one-factor-at-a-time approach, making Objective Experiments possible. Since then engineers can plan experiments that are thorough, efficient, and objective.
What's wrong with one-factor-at-a-time?
One-factor-at-a-time (OFAT) is subjective, not thorough and it ignores factor interactions. These are very big weaknesses that prevent you from finding your Sweet Spot—the optimal combination of factors for achieving your goals.
How can you get the most information for the least amount of work?
The key is to start with a Designed Experiment—a plan for collecting data. You use software to create a list of experiments to run. The results of the experiments will produce a model that will find a Sweet Spot, the combination of factors that will produce your desired product. You will now have contour plots, maps of how product responses vary as your factor levels change. You will be able to predict the results for experiment trials that you don't actually have to run! Designed experiments thoroughly cover the experimental space so that you can determine the effects of factor interactions.
I-Optimal designs
I-Optimal designs are the most efficient designs. They will give you the shortest list of experimental trials to run to extract the maximum amount of information--the information necessary to predict everywhere in the experimental space. These data are analyzed using Response Surface Methodology.
What is Response Surface Methodology(RSM)?
Response Surface Methodology creates a mathematical model in a computer using data collected from your designed experiment. With this model you can predict the results of experiments you have never run, saving time and money. This model will allow you to predict the best conditions for meeting your goal – your Sweet Spot.
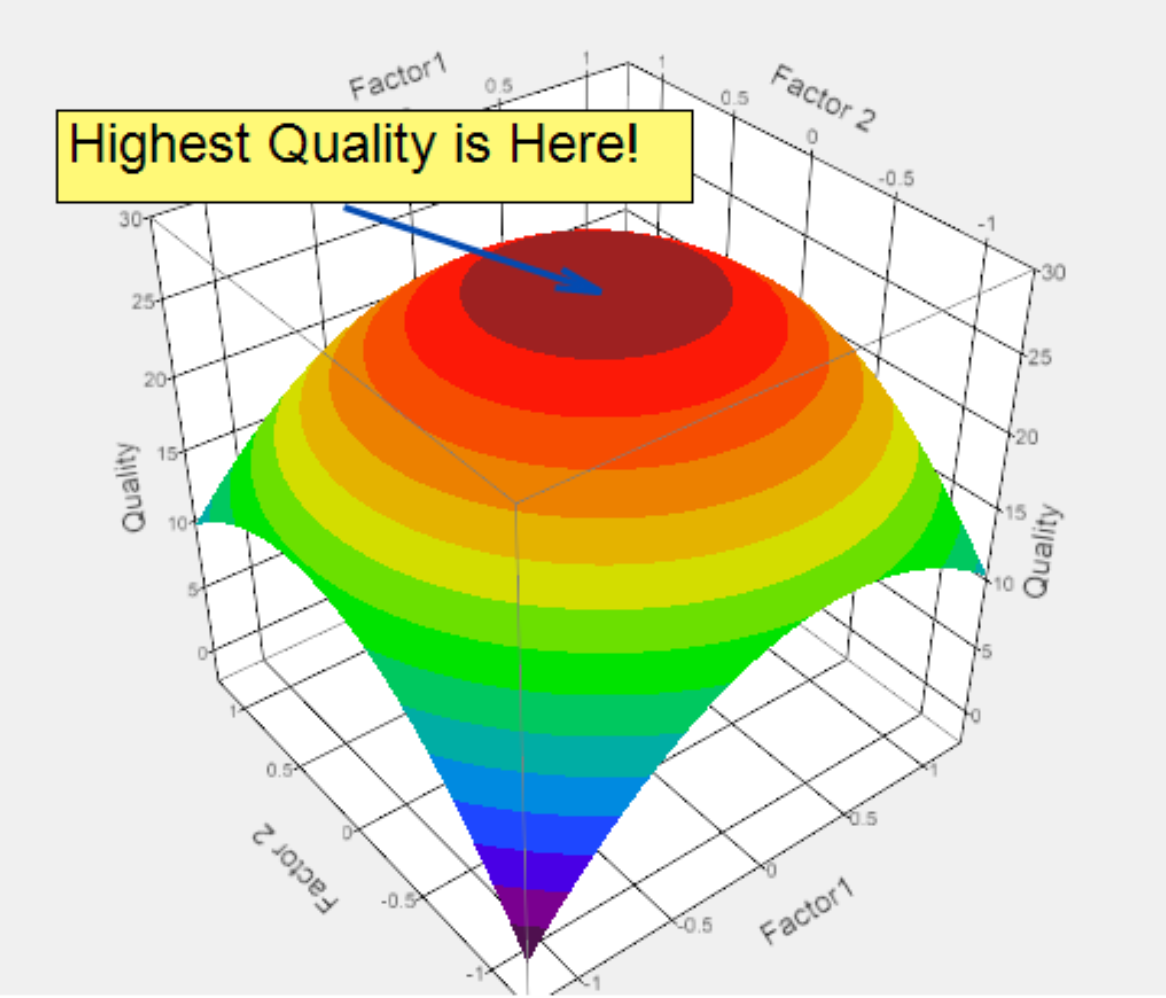
Suppose you have developed a way to measure the quality of digital photographs. This measure will likely include such features as bright colors, crisp image, pleasing contrast, etc. You can specify the acceptable limits for each quality feature and let your computer (using the mathematical model from your data) find the best combination of factors to meet your goals. You can even make a surface plot –a map–of how your product quality features change as your experimental conditions vary. You can see an example below.
How DOE and RSM Improve your Experimentation
DOE provides a list of trials that covers your factor ranges of interest (your “experimental space”). It will provide the information necessary for understanding factor interactions. This list is a very efficient way of collecting the information needed, keeping the cost of experimentation from growing out of control.
RSM provides the means for using the data you collected with your designed experiment to build a model that will find your Sweet Spot–the product with the highest desirability. Factor interactions are incorporated to find the best combinations.
Example 1: Hewlett Packard
The Hewlett Packard Paintjet printer was a great little printer. It was the first HP color ink-jet printer and it made very nice, colorful prints on HP special paper.
The Paintjet also printed on transparency film. Unfortunately, the print quality was not nearly as good on transparencies. They were very light and the colors were washed out. Management decided that improving the ink was the path to take. Many top performers at HP collected a lot of data about print quality on transparencies to no avail. HP management was about to conclude that the Paintjet should be sold as a paper- only printer.
I was fresh out of college, and I certainly wasn't considered a top- performer at the time. However, with DOE, I was able to solve the problem in under six months.
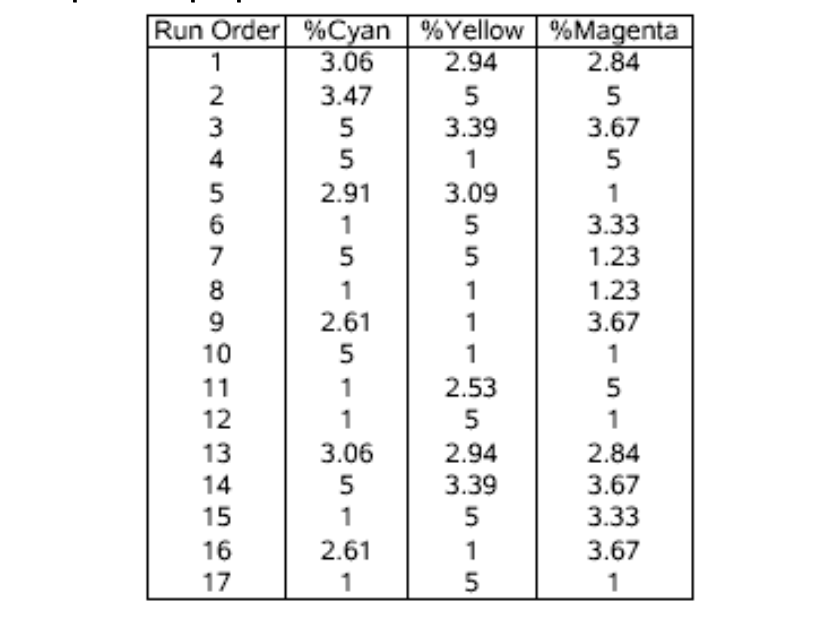
First, we created an experimental design, a list of experiments to perform, specifying how the potentially important factors were to be varied for each experimental trial. An example I-Optimal design created for this problem is shown below.
Next, using RSM, we fit a model with the data collected using the list of experiments above. This model predicted the best combination of factor levels to produce the highest print quality.
The resulting inks not only produced darker, more vibrant overhead transparencies, but the number of colors they could produce on paper more than doubled.
Why hadn't the top-performers found this without DOE? Because the problem is very complex with a huge number of possible solutions. Design of Experiments made this problem solvable by providing an economical list of experiments to perform and producing a model of the results. I performed only 46 experimental trials. The resultant model allowed me, quickly, to determine the best possible trial–the Sweet Spot–by making predictions.
This quality improvement made the Paintjet an excellent printer, and set an example for all future ink-jet printers.
Example 2: Lexmark International
Lexmark had a problem with their black ink-jet ink. HP had released a black ink using pigment, instead of dye, that was substantially more lightfast–it faded very slowly in the light. Lexmark was still selling a black ink with a dye that faded much too rapidly in comparison.
Lexmark had been trying to develop a pigmented black ink. They had produced a chemical vehicle for holding the pigments in suspension in the inks, chemicals that didn't violate any patents. Unfortunately, they were not finding an ink formulation that would work in their printers.
This is how things were when I arrived at Lexmark. I began applying DOE and RSM to the problem and fairly quickly had some success. When a colleague, Ann Pearson, helped me to include some of Lexmark's chemicals to keep the pigments in suspension, we quickly found a solution.
The success here occurred for the same reasons it occurred at HP: The huge number of possible experimental trials was reduced to a manageable list using an experiment design, and RSM produced a model that allowed us quickly to predict the Sweet Spot and develop it.
Lexmark began training their engineers and chemists in DOE and RSM. After learning these techniques, the same techniques that Objective Experiments teaches today, Ajay Suthar improved the black ink even further. Here's what the May 1997 “Hardcopy Observer,” an important journal in the printing field, said:
After years of playing a come-from- behind game that has depended more on deep discounts than R&D prowess, Lexmark has announced its first ink jet product that truly advances the state of the art. The new machine, the 7000 Color Jetprinter, is the first ink jet printer from any vendor that can truly claim to offer laser-quality text printing.
Example 3: Monsanto
Along with HP and Lexmark, Monsanto has made major quality improvements using DOE and RSM.
Peter Tkaczuk describes his use of DOE and RSM to develop high quality pressure sensitive adhesives at Monsanto in his paper, “Formulating Solvent PSAs Using Designed Experiments.” As is almost always the case, Peter found that many different properties had to be optimized to produce a high quality adhesive. In Peter's own words,
The difficulty of determining the optimum combination of factors increases dramatically with more performance criteria to consider, such as shear strength, tack, cost, etc.
Peter conquered this difficulty in the same way the problems at HP and Lexmark were solved. He used a designed experiment to provide an efficient list of experimental trials, reducing the potential number of experiments to run very substantially. He used RSM to produce a model that allowed him quickly to predict a Sweet Spot.
In all three adhesives, Peter's formulations either exceeded company expectations for quality, or surpassed industry standards for quality.
Learning DOE and RSM Can Be Easy
Design of Experiments and Response Surface Methodology rely heavily on complex math and Statisitcs. Because of this, DOE and RSM have been the domain of Statisticians. These extremely valuable tools have been hidden from most engineers by math and jargon.
Objective Experiments's specialty is making complex subjects practical. Thanks to the workshop, “Performing Objective Experiments,” and major advances in Statistical software packages, you can learn DOE and RSM with no math and a bare minimum of new terminology. In fact, learning DOE and RSM can be fun and easy!
Conclusion
In this post you have seen that Design of Experiments(DOE) and Response Surface Methodology (RSM) can be used to reduce an huge number of possible experimental trials to a manageable list. Your project's Sweet Spot is waiting out there for you to find it.
Looking for More?
Here are some interesting references for further information:
Dragone, et al, “Improvement of the Ethanol Productivity in a High Gravity Brewing at Pilot Plant Scale,” Biotechnol Lett. 2003, July 25(14), pps. 1171-1174.
Lee, et al, “TVA Pilot Plant Phosphates Flotation Conditioning Study,” Nutrient Cycling in Agroecosystems, Vol 29, No 3, Sept. 1991, pps. 347-363.
Canettieri, et al, “Optimization of Acid Hydrolysis from the Hemicellulosic Fraction of Eucalyptus Grandis Residue Using Response Surface Methodology,” Bioresour Technol, 2007, Jan, 98(2), pps. 422-428.
Ahmad, et al, “Optimization of Coagulation-Flocculation Process for Palm Oil Mill Effluent Using Response Surface Methodology,” Environ Sci Technol, 2005, April 15, 39(8), pps. 2828-2834.
Kappele, William D, “Quantifying Color Gamut,” Proceedings of IS&T's NIP 13: International Conference on Printing Technologies, Nov. 2-7, 1997, pps. 470-474.
Questions?
If you have questions about this post or are looking for more information, please contact us.